Graphs and Charting in Excel

About Course
Grasp the tools and skills for visualizing your Excel reports using charts and graphs.
Learn the chart elements, scaling, axis labelling, adding data labels, titles and axis labelling in Excel.
Course Content
Graphs and Charting in Excel
-
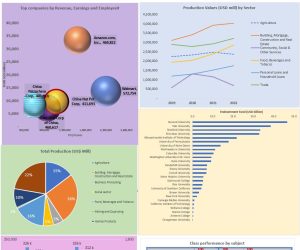
Overview of different charts in Excel
09:24 -
How to Discern the best chart to suit a dataset or analysis
04:21 -
General chart attributes and basics of a pie chart
13:46 -
Overview of Bubble Charts
13:10 -
Data analysis and reporting using Combo charts
05:31 -
Understanding line graphs
03:39 -
Bar and column charts in Excel
05:04 -
Overview of Box Plots
02:48 -
Box-plot display options
03:03 -
Box-plot axes and data labels
03:01 -
Interpreting a box plot
02:46
Student Ratings & Reviews

wawo its my pleasure to have this course ,and the instructor is really doing a grate good job well explained graphs thank you

A very good match for me.