This short course has been offered free to our learners constitutes one of the ten modules in our Excel Fundamentals Course. By undertaking this course, a l learner has an option of completing the quiz and is awarded with a certificate of completion.
The lesson in this short course include:
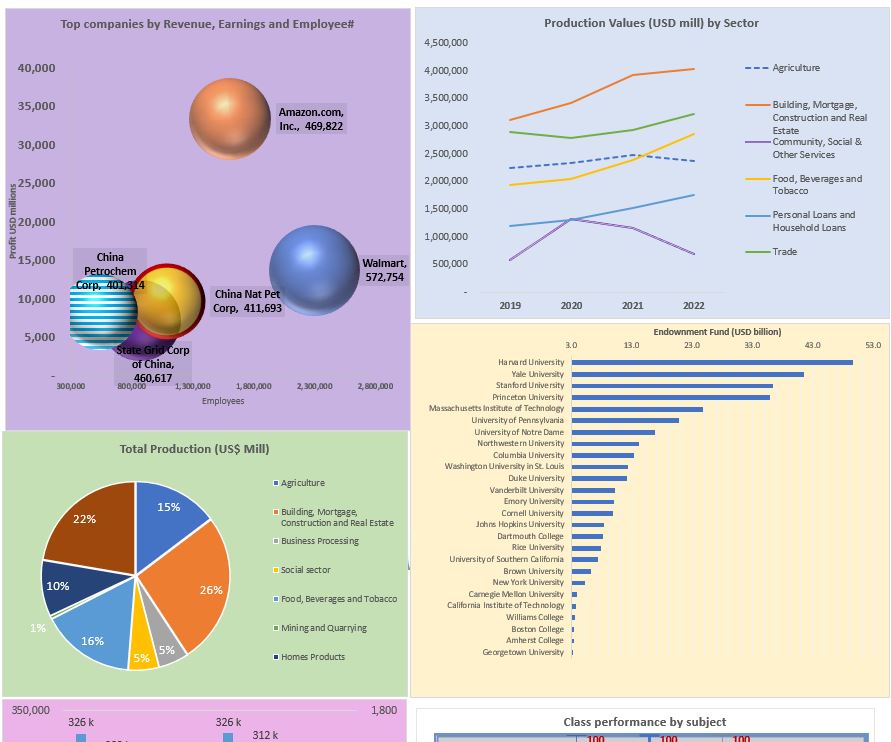
- Overview of Charts in Excel
- How to discern the best chart to suit a dataset or analysis.
- General chart attributes and basics of a pie chart
- Overview of Bubble Charts.
- Data analysis and reporting using combo charts.
- Understanding Line Graphs
- Bar and column charts in Excel
- Overview of Box-plots
- Box-plot display options
- Box-plot Axes and Data Labels
- How to interprete Box-plots
Open the Video-based Course here (register if a first time user