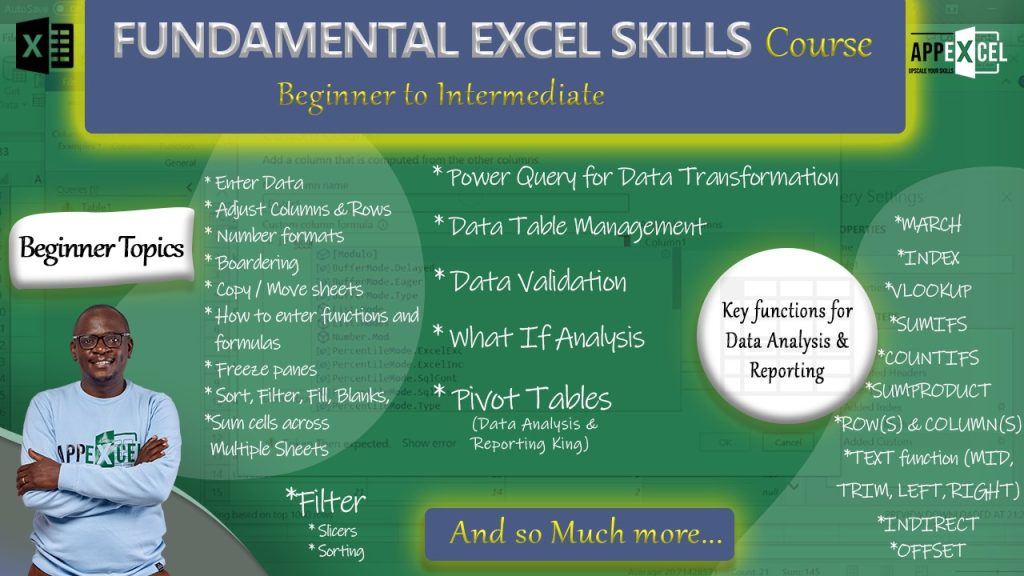
Module 1: Basics of Microsoft Excel
- How to open Excel
- Entering and saving data
- Opening Saved Data
- Understanding the structure of rows and columns in Excel
- Overview of the Excel Window/Graphic User Interface
- Basics of Data Analysis
- Overview of Excel Formats
- Difference between a Workbook and Worksheet
- Copying an excel worksheet within and outside a workbook
- Adding columns and rows in excel.
- Hide or Unhide rows and Columns.
- Freeze panes
Module 2: Essential Tools for Data Analysis
- Introductory skills in data analysis.
- Data filtering
- Advanced data filtering
- Adding Number Format
- Moving sheets in a workbook
- Selections and Boardering ranges in excel
- Formatting data as an Excel Table
- Benefits of Excel Table formats
- Data Table Management
- Multiple Sheet Operations
- Suming cells across All Sheets in a workbook
- Sum All Sheets by use of ‘Start-End’ Sheets
- Data Entry Form in Excel
- Data Validation
- Removing duplicates in a list in excel
- The ‘Text-to-Column’ functionality in excel
- Page Lay-Out, repeating row and column titles on printing, grid lines, freezing panes and print options in excel
Module 3: Data analysis using Pivot Tables
- Using the drag and drop functionality to construct PivotTables.
- Adding filters Filter for PivotTables
- Filtering using slicers.
- Sorting Pivot Table Values
- Value field settings: Sum vs Count of Value THEN percent
- Constructing Frequency Distribution analysis in Pivot Tables
- Smart Number Formats and Conditional Formats in Pivot Tables
Module 4: Overview of formulas and functions
You will learn the fundamental principles of working with functions and formulas in excel including:
Absolute and Relative Referencing of functions and formulas. In addition, the learner will get introduced to basic and intermediate as well as advanced functions including.
- SUM
- AVERAGE
- COUNT
- RANK
- MOD
- MIN
- MAX
- IF
- COUNTIFS
- SUMIFS
- VLOKUP
- MATCH
- INDEX
- SUMPRODUCT
- ROWS
- COLUMN
- ROWS
- COLUMS
- INDIRECT
- INDIRECT with ROW/COLUMN
- OFFSET
- NESTED Ifs (AND/OR) and their comparison with the OFFSET function
- Use of Power query to circumvent the data transformation complexity of the OFFSET function
Module 5: Conditional Formatting for Data Visualization
Learn how to quickly visualize data using conditional formats including:
- The use of highlight rules, Data bars, color scales and icon sets to visualize data
- Visualization of Conditional Formats using formulas to define rules
- Application of formula-based Conditional Formatting including highlighting data based on multiple criteria
Module 6: What-if-Analysis for scenarios management and sensitivity analysis
What-if-analysis is a superior functionality in excel used for assessing projections and business analysis. As the name suggests, this set of commands enables the user to investigate the result ‘what-if’ an input/assumption parameter was to change/materialize differently. The lessons in this module include:
- The use of the Goal-Seek Excel command.
- Using the Scenario Manager for sensitivity analysis
- Use of Named-Cell functionality with the Scenario Manager
- Introducing Data Table for sensitivity analysis covering both the one-variable data table and the two-variable data table
Module 7: Keyboard Shortcuts in Excel
Keyboard shortcuts are central to achieving efficiency in excel. Explore the key shortcuts to make work in Excel enjoyable, time-saving and time-efficient. The Module consists of two lessons. These include:
- Overview of Excel Shortcuts
- Important Excel Shortcuts
Module 8: Charts and Graphs for enhanced data Visualization and Analysis
This short course has been offered free to our learners constitutes one of the ten modules in our Excel Fundamentals Course. By undertaking this course, a l learner has an option of completing the quiz and is awarded with a certificate of completion.
The lesson in this short course include:
- Overview of Charts in Excel
- How to discern the best chart to suit a dataset or analysis.
- General chart attributes and basics of a pie chart
- Overview of Bubble Charts.
- Data analysis and reporting using combo charts.
- Understanding Line Graphs
- Bar and column charts in Excel
- Overview of Box-plots
- Box-plot display options
- Box-plot Axes and Data Labels
- How to interprete Box-plots
Module 9: Data Analysis Case Studies and applications
- Introduction to the use of the Offset function for data analysis
- Application of OFFSET function to analysis of sales data
- Using the OFFSET function across multiple columns
- Combining the OFFSET function analysis with charts
- Introducing the SUMPRODUCT function
- Combining the OFFSET function with the SUMPRODUCT function
- Introducing Power Query Transformation to Data Analysis
Module 10: Power Query in Excel
- Introduction to Powery
- Data Extraction in power query
- Power query extraction of data from different sources
- Working with Applied steps
- Custom columns
- Splitting columns, merging columns and number formats in power query
- Loading options for power query.
Fundamentals of Ms. Excel (Course Content – Video)

This will make work of every data analyst in every category easy.
Thanks Sylvia
I wish to participate in all this
You are most welcome on board mate.
Don’t leave me behind guys. This is soo nice especially to these big figures we deal with in our daily work.
Thank you.
You are welcome to our online school.
This is worth the time. The course content is detailed and very spot on.
Oh my!! U guy you are so swift
This is detailed information , thank you for good work
You are most welcome Elias